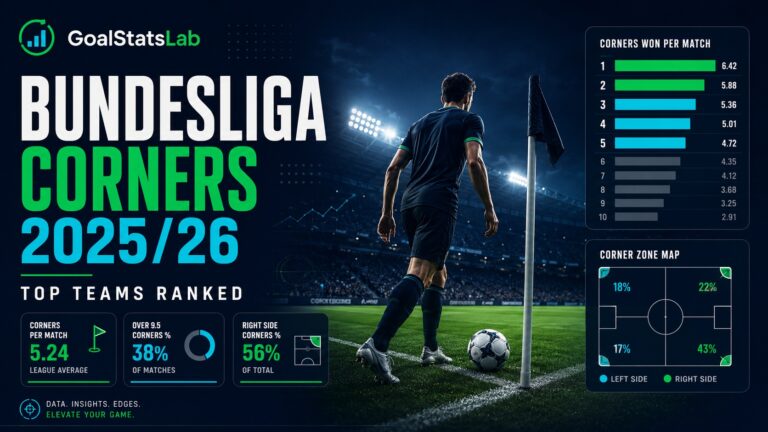
Bundesliga Corners 2025/26: Teams With the Most Corners
Bundesliga Corners rankings for 2025: Bayern München lead with 6.35 using GoalStatsLab data.
Introduction Expected Goals in football, commonly known as xG, is one of the most important metrics in modern football analysis. It helps measure the quality of scoring chances...
Expected Goals in football, commonly known as xG, is one of the most important metrics in modern football analysis. It helps measure the quality of scoring chances and gives a clearer view of team performance beyond the final score.
For many years, fans looked mainly at goals, possession, shots, corners, and league position. But those numbers do not always tell the full story. A team can take 20 shots and still create very little danger. Another team can take only 7 shots but create much better chances.
This is where Expected Goals in football becomes useful.
xG helps answer one simple question:
How likely was each shot to become a goal?
This makes xG very useful for football fans, analysts, betting researchers, and prediction platforms. At GoalStatsLab, xG can help explain team performance, attacking strength, defensive weakness, and match prediction confidence.
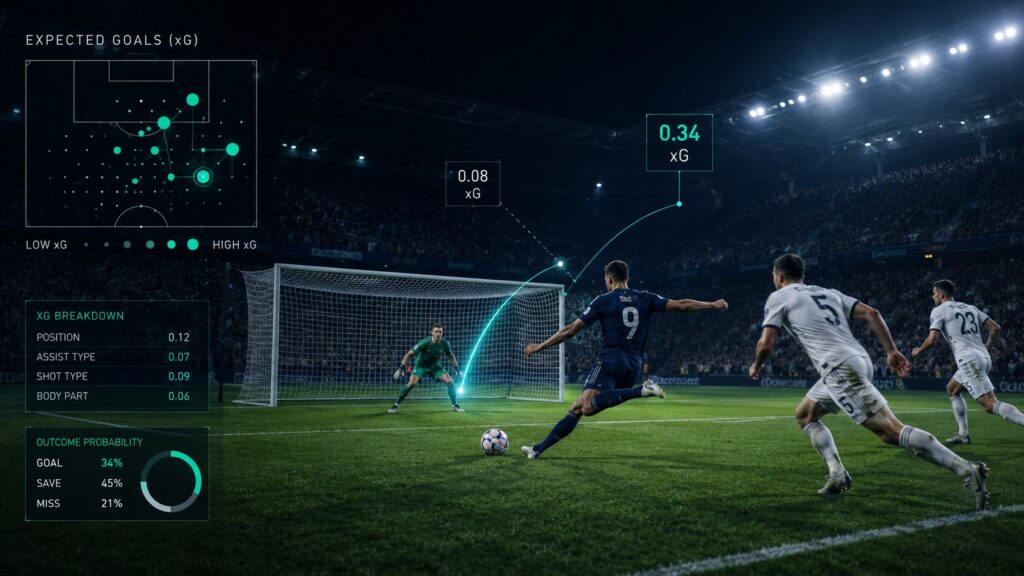
Expected Goals in football is a statistical metric that estimates the probability of a shot becoming a goal.
Every shot is given a value between 0 and 1.
For example:
| xG Value | Meaning |
|---|---|
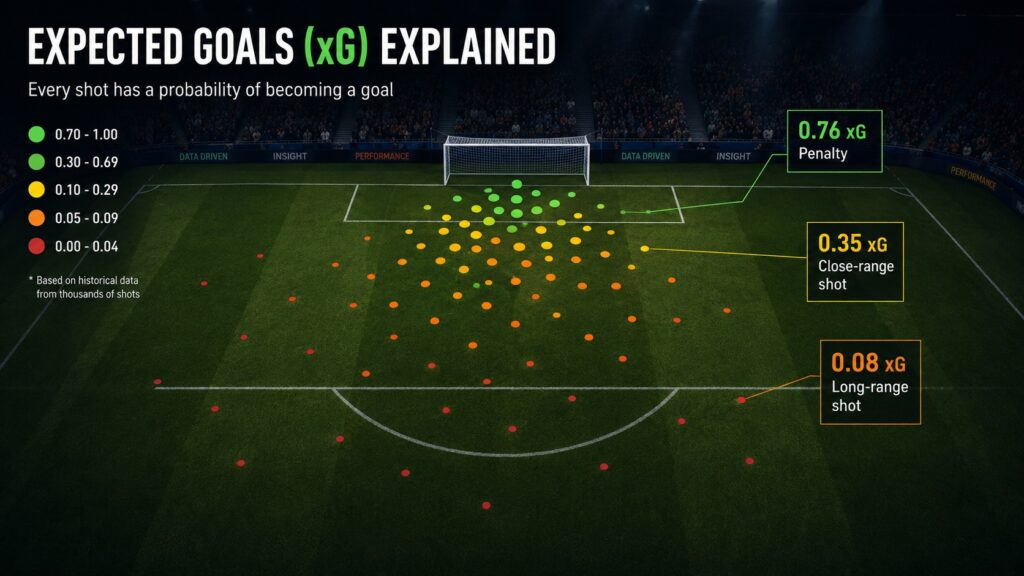
| 0.03 xG | Very low-quality chance |
| 0.15 xG | Difficult chance |
| 0.35 xG | Good chance |
| 0.70 xG | Very big chance |
A shot with 0.20 xG means that similar shots would be expected to become goals around 20 times out of 100.
The purpose of xG is not to predict with certainty whether a shot will be scored. Football is unpredictable. Goalkeepers, pressure, technique, weather, and luck can all affect the final result.
The real value of xG is that it measures the quality of the opportunity.
A penalty, for example, usually has a high xG because penalties are scored often. A long-distance shot from a poor angle usually has low xG because similar attempts rarely become goals.
Different data providers use different xG models, but most models consider similar factors.
Expected Goals in football is usually calculated using details such as:
The closer and clearer the chance, the higher the xG value.
For example, a shot from inside the six-yard box will normally have a much higher xG than a shot from 30 meters. A central shot is usually more dangerous than a shot from a tight angle. A one-on-one chance is usually more valuable than a crowded shot with many defenders blocking the goal.
This is why Expected Goals in football gives more context than simple shot numbers.
The number of shots can be misleading.
A team may finish a match with 18 shots, but if most of them are from outside the box, blocked, or taken under pressure, the team may not have created many real scoring chances.
Another team may take only 8 shots but create 3 or 4 clear opportunities.
Example:
| Metric | Home Team | Away Team |
|---|---|---|
| Shots | 18 | 8 |
| Shots on target | 5 | 4 |
| Expected Goals | 0.95 | 2.20 |
| Final Score | 1 | 2 |
At first, it looks like the home team attacked more because they had more shots. But the xG shows that the away team created the better chances.
This is why Expected Goals in football is useful. It separates shot quantity from shot quality.
The final score tells you who won.
xG helps you understand who created the better chances.
Expected Goals in football should not be used alone. The best predictions come from combining xG with recent form, goals, injuries, team news, home advantage, and betting odds.
However, xG can give a strong foundation for smarter match analysis.
Here are 7 key ways to use xG for match predictions.
xG For measures the quality of chances a team creates.
A team with high xG For is usually creating dangerous opportunities, even if it does not always score many goals.
Example:
| Team | Goals Per Match | xG For Per Match | Interpretation |
|---|---|---|---|
| Team A | 1.1 | 1.9 | Creates good chances but may be underperforming |
| Team B | 2.0 | 1.1 | Scores a lot but may be overperforming |
Team A may be more dangerous than its recent results suggest. If it continues to create strong chances, goals may eventually come.
This is important for predictions because results do not always reflect performance. A team can lose matches but still create enough chances to suggest future improvement.
When analyzing a match, check whether a team is creating consistent xG across several games, not just one match.
xG Against measures the quality of chances a team allows opponents to create.
A team with high xG Against is usually giving away dangerous chances.
Example:
| Team | Goals Conceded Per Match | xG Against Per Match | Interpretation |
|---|---|---|---|
| Team A | 0.8 | 1.8 | Defensive numbers may be lucky or goalkeeper-dependent |
| Team B | 1.7 | 0.9 | May be conceding more than expected |
Team A may look strong defensively because it has conceded few goals. But if its xG Against is high, the team may be allowing too many dangerous chances.
This can be a warning sign.
Expected Goals in football can help detect defensive problems before they become obvious in the scoreline.
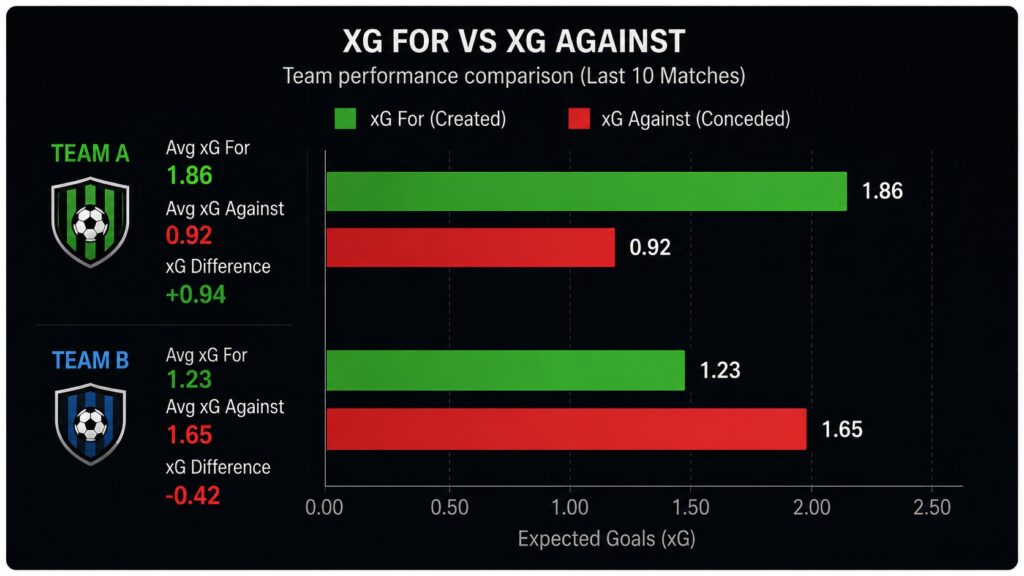
One of the most useful xG indicators is xG Difference.
It is calculated like this:
xG Difference = xG For – xG Against
Example:
| Team | xG For | xG Against | xG Difference |
|---|---|---|---|
| Team A | 2.10 | 0.80 | +1.30 |
| Team B | 1.20 | 1.70 | -0.50 |
Team A creates more danger than it allows. Team B allows more danger than it creates.
A positive xG difference usually indicates a stronger team performance. A negative xG difference can suggest weakness, even if the team has been getting good results.
For match predictions, comparing xG difference helps identify which team has the better overall process.
A team with a strong positive xG difference is often more reliable than a team winning matches with very low chance creation.
Some teams score more goals than expected.
This can happen because of:
Example:
| Team | Goals Scored | Expected Goals |
|---|---|---|
| Team A | 20 | 12.5 |
This team has scored much more than its xG. That does not automatically mean the team is bad. Some teams have excellent finishers and can outperform xG for a period.
However, extreme overperformance can be difficult to maintain.
Expected Goals in football helps identify when a team may be getting results that are better than its underlying performance.
For predictions, this matters because a team may look stronger in the table than it actually is.
Some teams create many good chances but fail to score enough goals.
Example:
| Team | Goals Scored | Expected Goals |
|---|---|---|
| Team B | 10 | 18.2 |
This team is scoring much less than expected.
That may suggest:
But if the team keeps creating high-quality chances, improvement may come.
This is one of the best uses of Expected Goals in football. It helps identify teams that are playing better than their results show.
For predictions, underperforming teams can be interesting because the market may undervalue them if people look only at recent results.
Expected Goals in football is very useful when analyzing goal markets such as Over 2.5 Goals.
A match may have strong goal potential if both teams:
Example:
| Team | Average xG For | Average xG Against |
|---|---|---|
| Home Team | 1.85 | 1.40 |
| Away Team | 1.60 | 1.55 |
This profile suggests that both teams create chances and also allow chances. That can increase the potential for goals.
However, xG should still be combined with team news, league style, motivation, and odds.
A high xG trend does not guarantee Over 2.5 Goals, but it gives useful evidence.
BTTS means Both Teams to Score.
Expected Goals in football can help estimate whether both teams are likely to create enough chances to score.
Important indicators include:
A match may have BTTS potential if both teams usually create more than 1.20 xG and both teams also concede good chances.
Example:
| Team | xG For | xG Against | BTTS Signal |
|---|---|---|---|
| Home Team | 1.70 | 1.35 | Strong |
| Away Team | 1.45 | 1.60 | Strong |
In this case, both teams have attacking potential and both defenses allow chances.
Again, this is not a guarantee. But it is a useful signal when combined with other data.
Expected Goals in football can support different types of match analysis.
For win, draw, or loss predictions, xG can help identify which team has the better performance level.
A team may be high in the league table but have weak xG numbers. Another team may be lower in the table but have strong xG numbers.
This can reveal hidden value.
xG helps measure whether teams are creating and conceding enough high-quality chances for a high-scoring match.
xG can show whether both teams are likely to create scoring opportunities.
Correct score is difficult to predict, but xG can help estimate likely score ranges. For example, a match where both teams average around 1.5 xG may have a stronger chance of ending 1-1, 2-1, or 1-2 than 0-0.
xG For and xG Against can help estimate whether one team is likely to score over or under a certain number of goals.
Still, xG should never be used as the only factor. Betting analysis should always include context, odds, injuries, tactical style, and recent form.
Football analytics is becoming more advanced. Traditional xG is still important, but new metrics add more detail.
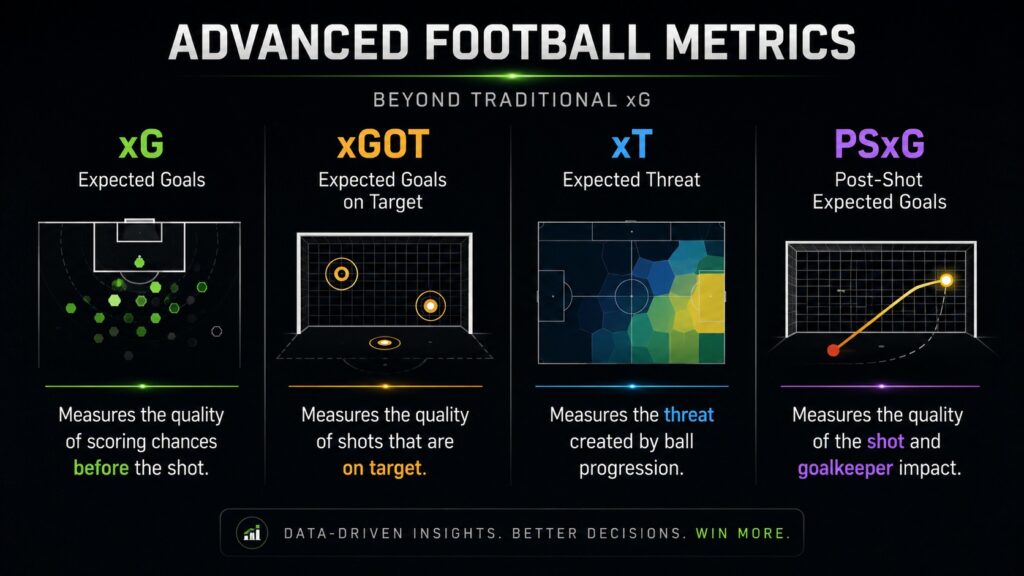
xGOT measures the quality of shots that are actually on target.
While xG evaluates the quality of the chance before the shot, xGOT considers where the shot was placed.
A weak shot straight at the goalkeeper may have low xGOT. A powerful shot into the corner may have high xGOT.
Expected Threat measures how much danger a team creates through ball progression.
A pass into a dangerous area can increase threat even if it does not immediately lead to a shot.
This is useful because not all dangerous attacks end with a shot.
Post-Shot Expected Goals measures the quality of a shot after it is taken.
It can help evaluate finishing quality and goalkeeper performance.
For example, if a goalkeeper saves many high PSxG shots, it may indicate strong shot-stopping performance.
These metrics do not replace Expected Goals in football. They add more context and help create a deeper analysis.
Expected Goals in football is powerful, but it can be misused.
Here are common mistakes to avoid.
One match can be misleading. A team can have one high-xG match and then struggle in the next games.
It is better to analyze:
Some teams create high xG at home but struggle away.
Always compare home and away data separately.
A team may have low xG because it recently played against strong opponents. Another team may have high xG because it played weak defenses.
Context matters.
xG does not predict the exact result. It estimates chance quality.
Football still depends on finishing, goalkeepers, tactical decisions, red cards, injuries, and random events.
Elite forwards may outperform xG for long periods. Poor finishers may underperform.
xG is a team and chance-quality tool, but player quality still matters.
To understand Expected Goals in football better, you can also read data explanations from football analytics platforms such as:
These sources can help you understand how xG is used by analysts, clubs, data providers, and football researchers.
Expected Goals in football is one of the most useful metrics for understanding modern football.
It helps separate real performance from simple results. It shows whether a team is creating strong chances, allowing dangerous opportunities, overperforming, or underperforming.
The best way to use xG is not to look at it alone. It should be combined with recent form, team news, home and away data, injuries, tactical context, odds, and other football statistics.
For match predictions, the 7 key uses of xG are:
The final score tells you what happened.
Expected Goals in football helps explain why it happened.
And when used correctly, xG can help you make smarter football analysis before the next kickoff.
Want smarter football predictions based on data?
Explore GoalStatsLab match analysis, team statistics, prediction insights, and football trends before the next game.
Bundesliga Corners rankings for 2025: Bayern München lead with 6.35 using GoalStatsLab data.

Premier League shots on target data gives us a clearer view of which players are not only shooting often, but […]

Premier League most shots data for the 2025/26 season gives us a clear view of which players are carrying the […]