World Cup 2026 stats are already showing some interesting early patterns in the group stage. The tournament has started with the largest field in history: 48 teams, 104 matches and three host nations sharing the stage across the United States, Mexico and Canada.
A few matchdays into the group stage, the early numbers are already giving us useful signals. Some results have matched the underlying data. Others have been more misleading, with teams either overperforming their finishing or failing to convert strong chances.
At GoalStatsLab, we look beyond the scoreline. Goals matter, but expected goals, shot quality, match control and group-stage pressure often tell a deeper story. This article breaks down the main World Cup 2026 stats, xG trends and prediction angles from the early games heading into Matchday 2.

According to the official FIFA match centre, the 2026 World Cup is being played across the United States, Mexico and Canada with 48 teams and 104 matches.
Early xG Snapshot: What the Numbers Say
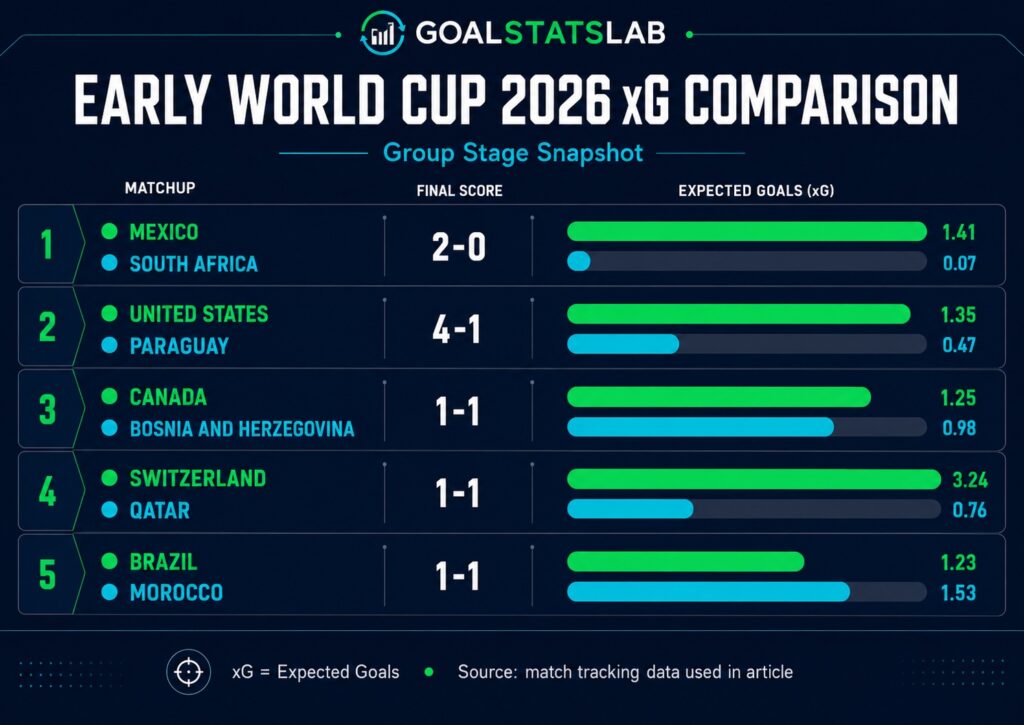
Here are some of the key early matches from the group stage, using available expected goals data:
| Match | Score | xG | Main Reading |
|---|---|---|---|
| Mexico vs South Africa | 2-0 | 1.41 – 0.07 | Mexico controlled the match and limited South Africa almost completely |
| South Korea vs Czechia | 2-1 | 1.84 – 0.81 | South Korea deserved the win based on chance quality |
| Canada vs Bosnia and Herzegovina | 1-1 | 1.25 – 0.98 | A balanced match, but Canada created slightly better chances |
| United States vs Paraguay | 4-1 | 1.35 – 0.47 | USA deserved the win, but also overperformed their xG |
| Qatar vs Switzerland | 1-1 | 0.76 – 3.24 | Switzerland dominated the underlying numbers but failed to win |
| Brazil vs Morocco | 1-1 | 1.23 – 1.53 | Morocco created the better chances despite Brazil avoiding defeat |
| Haiti vs Scotland | 0-1 | 1.21 – 1.05 | Scotland took the result, but the xG was very close |
The first major takeaway is simple: early World Cup scorelines can be noisy. A 4-1 win does not always mean total attacking dominance, and a 1-1 draw does not always mean the teams performed equally.
That is why xG is useful. It helps separate finishing, luck and game state from the actual quality of chances created.
For readers new to this metric, our full guide to Expected Goals in Football explains how xG works and why it matters for match analysis.
Host Nations Have Started Strongly
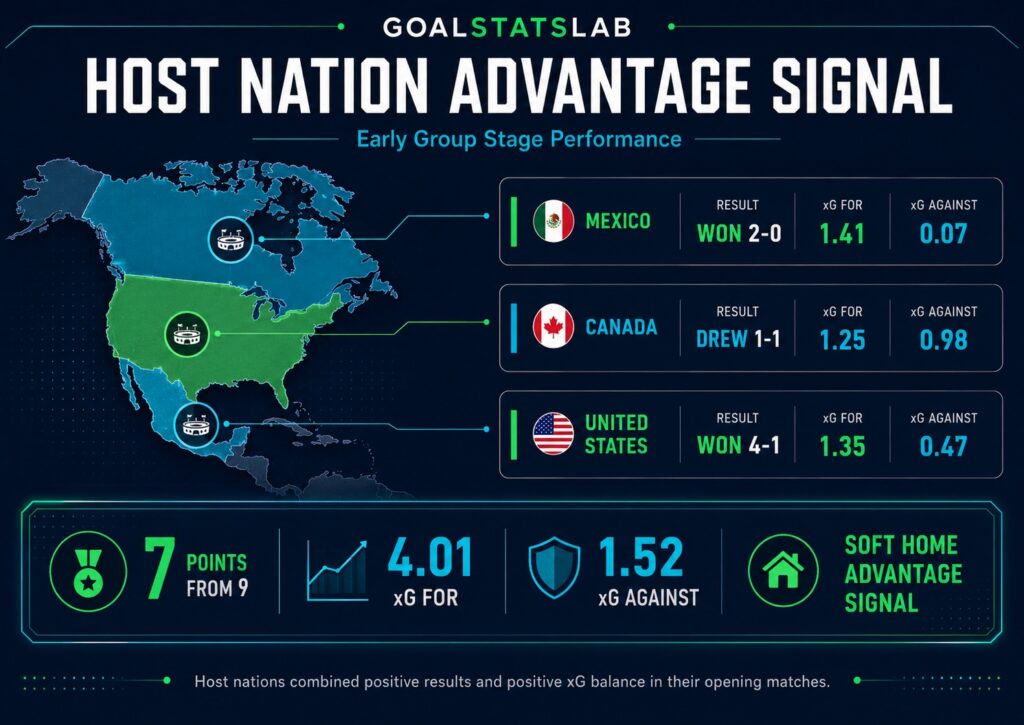
One of the clearest early patterns is the positive start from the three host nations.
Mexico opened with a 2-0 win over South Africa. The United States followed with a 4-1 victory over Paraguay. Canada picked up a 1-1 draw against Bosnia and Herzegovina.
Together, the three host nations collected 7 points from their opening matches. Their combined xG was also positive:
| Host Team | Result | xG For | xG Against |
|---|---|---|---|
| Mexico | Won 2-0 | 1.41 | 0.07 |
| Canada | Drew 1-1 | 1.25 | 0.98 |
| United States | Won 4-1 | 1.35 | 0.47 |
| Total | 7 points from 9 | 4.01 | 1.52 |
This supports an important prediction idea: home advantage is not completely removed just because the tournament is played across multiple cities and stadiums.
The USA, Mexico and Canada are not playing every match in a traditional home stadium, but they still benefit from familiar conditions, shorter travel, stronger crowd support and less disruption than most visiting teams.
This connects directly with our Home Advantage in Football framework. In a co-hosted World Cup, host status should probably be treated as a soft home-advantage signal.
It is not as strong as a normal league home match, but it is not zero either.
Prediction takeaway: host nation status should be included as a small but meaningful variable, especially in group-stage matches where crowd energy and travel conditions can affect tempo, pressure and momentum.
World Cup 2026 Stats for Goals, BTTS and Over 2.5
The early goal data shows a mixed picture.
Across the first xG-tracked matches listed above, there were 17 goals in 7 games, an average of 2.43 goals per match. That is not an extremely high-scoring start, but there are two important details:
- BTTS landed in 5 of those 7 matches.
- Over 2.5 goals landed in only 2 of those 7 matches.
That means the early tournament has produced several balanced scorelines rather than constant goal-heavy games.
This matters for prediction models. A match can be good for BTTS without necessarily being good for Over 2.5. For example, 1-1 results can support a BTTS read while still staying under the 2.5 goals line.
So far, the strongest early attacking signal came from the United States’ 4-1 win over Paraguay. However, the xG tells us the scoreline was more clinical than dominant. USA created enough to win, but four goals from 1.35 xG suggests strong finishing rather than repeatable chance volume.
On the other side, Switzerland’s 1-1 draw against Qatar is a perfect example of why xG matters. Switzerland produced 3.24 xG but only scored once. That kind of gap is important heading into Matchday 2, because it may point to bounce-back potential if the same chance creation continues.
Favorites Are Not Always Convincing — And That Is Normal
One of the most common mistakes in World Cup analysis is judging teams only by the final score.
Early in major tournaments, even strong teams can look uneven. Fitness, nerves, rotation, climate, pitch conditions and tactical caution all affect performance. A favorite can win without playing well, and another favorite can draw despite producing the better chances.
Brazil’s 1-1 draw against Morocco is a good example. The result may look like a standard opening-game draw, but the xG tells a different story: Morocco created slightly better chances.
Switzerland’s draw against Qatar tells the opposite story. The result was disappointing, but the performance data was much stronger than the scoreline.
This is where xG-based analysis becomes valuable. The key is not just asking who won, but whether the performance behind the result was sustainable.
A team that wins 2-0 from very low xG may not be as strong as the score suggests. A team that draws 1-1 while creating 3+ xG may be a better Matchday 2 candidate than the table shows.
What to Watch in Matchday 2
As the second round of group matches approaches, these are the main data-driven storylines to follow.
1. Switzerland’s Bounce-Back Signal
Switzerland created 3.24 xG against Qatar but only scored once. That kind of performance usually deserves attention in the next match.
If Switzerland continue to create high-quality chances, their finishing numbers could improve quickly.
2. Brazil’s Response Against Haiti
Brazil avoided defeat against Morocco, but the underlying numbers were not dominant. Their next match will be important for understanding whether the opener was just a slow start or a real tactical warning.
Against Haiti, Brazil will be expected to control the ball, create more shots inside the box and turn possession into better xG.
3. USA: Real Strength or Finishing Spike?
The United States started with a 4-1 win, which is excellent for confidence and goal difference. But 4 goals from 1.35 xG suggests they finished at a very high rate.
That does not mean the performance was weak. It simply means the next match will tell us more about whether the USA can keep creating enough chances to support similar scorelines.
Their second match against Australia should be one of the most interesting early tests for the host-nation effect.
4. Mexico vs South Korea Could Shape Group A
Mexico and South Korea both started with wins. Their next meeting could be decisive for the top of Group A.
Mexico were defensively dominant against South Africa, allowing only 0.07 xG. South Korea, meanwhile, created 1.84 xG against Czechia. That sets up a strong tactical contrast: Mexico’s control versus South Korea’s chance creation.
5. Third-Place Qualification Changes the Group Stage
The 2026 format changes the psychology of the group stage. With 12 groups of 4 teams, the top two teams in each group advance, along with the eight best third-placed teams.
That means more teams remain alive deeper into the group stage. From a prediction point of view, this can reduce the number of completely meaningless matches, but it can also create more tactical complexity.
Some teams may push harder for goal difference. Others may protect a draw if four points are likely to be enough. This makes live context and group permutations especially important.
Prediction Angles to Track
Based on the early data, these are the key model signals worth monitoring:
| Signal | Why It Matters |
|---|---|
| Host nation status | USA, Mexico and Canada have started strongly and may still benefit from soft home advantage |
| xG vs actual goals | Helps identify teams that overperformed or underperformed their scoreline |
| BTTS trend | Early matches have produced several games where both teams scored |
| Finishing regression | Teams with high xG but low goals may become stronger candidates in Matchday 2 |
| Group pressure | Teams that lost their opener may attack more aggressively in their second match |
| Third-place race | The new format keeps more teams competitive for longer |
Final Thoughts
The early 2026 World Cup data shows why scoreline-only analysis is not enough.
The USA, Mexico and Canada have all started positively, supporting the idea that co-host status still carries some home-advantage value. Switzerland’s draw with Qatar shows how xG can reveal a strong performance hidden behind a disappointing result. Brazil’s draw with Morocco shows the opposite: a major team can avoid defeat without fully convincing in the underlying numbers.
Heading into Matchday 2, the most important things to watch are chance quality, finishing regression, host-nation momentum and group-stage pressure.
GoalStatsLab will keep updating its match predictions as each matchday finishes, including 1X2, Over 2.5 and BTTS reads based on form, xG trends and the latest tournament data.